
Warehouse temperature mapping
Warehouse temperature mapping: the procedure step by step, and the posted price
We ship calibrated wireless sensors for your racking, and your team places them low, middle and high with us on a video call. The readings reach us live for 7 days, and the signed report comes 2 business days after the study.
- No site visit
- 7 days, weekend included
- Summer and winter
- Report in 2 business days
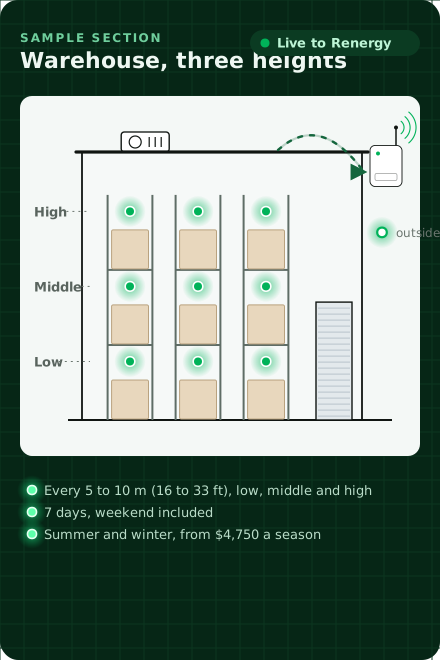
From $4,750per season, for about 10,000 sq ft
30 to 50sensors, low, middle and high
2 business daysto the signed report
How it works
From your warehouse racks to a signed report, live

Calibrated sensorsCertificates in the report
Own cellular linkNothing joins your network. No IT headache.
Signed by a certified engineerA Renergy engineer with career expertise in cold chain logistics
Packages
Every price, posted. Pick your unit.
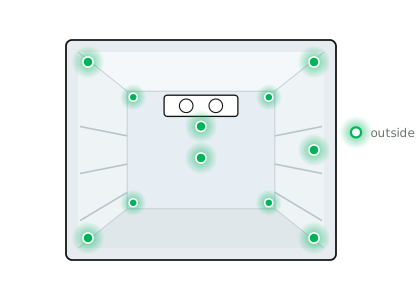
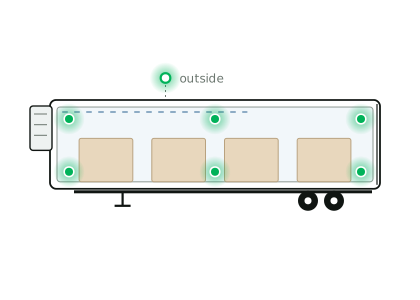
US dollars, before tax, for a remote study. Shipping at the carrier's rate, no markup. On-site service and -80°C (-112°F) freezers are quoted separately.
Keep some of the sensors after the study, and you have continuous monitoring for $250 a sensor a year.
See TemperatureWiseOrdering
Four steps, no site visit
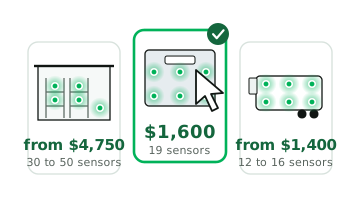
Pick a package
By unit size, with a date.
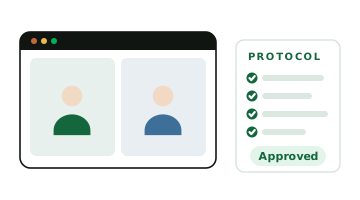
Approve the protocol
On a call, before we ship.
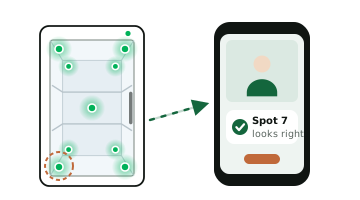
Place sensors on video
We check each spot with you.
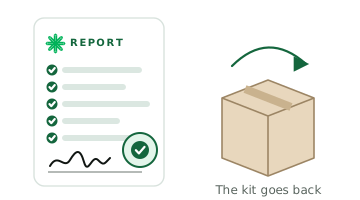
Get the signed report
2 business days after the study.
Need more hands-on help? We also offer assisted installation, up to full white-glove service, quoted separately.
Talk with usThe report
The report fills in while the study runs

The procedure
The warehouse temperature mapping procedure, step by step
1. Agree the protocol before anything ships
On a call, we agree what is mapped, the range the warehouse must hold, where each sensor goes, how long the study runs and which season it covers. You approve the protocol before we ship.
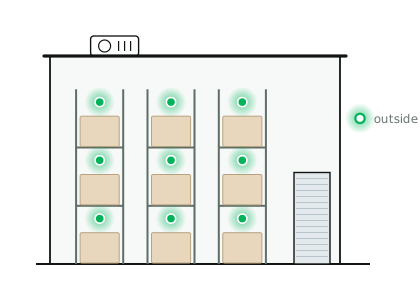
2. A sensor every 5 to 10 m, at three heights
WHO guidance puts sensors every 5 to 10 m (16 to 33 ft) across the floor, low, middle and high, because heat gathers under the roof and comes in at the docks and the outside walls. For about 10,000 sq ft (930 m²) that is 30 to 50 sensors.
3. Your team places them, and we check each spot on video
We ship numbered sensors with a placement map for your racking. Your team places them while we check each spot on a video call. The high spots need the lift you already use for your top racks.
4. 7 days, weekend included, in summer and in winter
The study runs at least 7 days and includes a weekend, when the doors stay shut. In July the roof bakes and the top racks run warm; in January the heating cycles and the dock doors let in cold. Where the seasons change the building, both are mapped.
5. The report sets where monitoring goes
The signed report gives the lowest, highest and average reading at every sensor, the warm and cold spots, any time outside the range, the mean kinetic temperature, the calibration certificates and the raw data, and marks where the permanent monitoring sensors should go.
6. Map again after changes, and on a cycle
WHO guidance maps a space before it is first used, again after any significant change such as new racking, a new HVAC unit or a new layout, and on a cycle such as every 3 years.
Who asks
Who asks for a warehouse map
Pharmaceutical distributors
USP's chapter 1079.4 describes mapping as how a drug storage area is qualified, and in Canada GUI-0069 makes it a rule for licence holders and their 3PLs.
Pharmaceutical warehouse mappingFood cold storage and 3PLs
Food cold stores map rooms and whole warehouses for their customers' audits.
Cold storage temperature mappingWHO
Maps a warehouse for at least 7 days including a weekend, at three heights, in summer and winter where the seasons matter.
WHO Supplement 8Common questions
What is warehouse temperature mapping?
A study that places 30 to 50 calibrated sensors through a warehouse of about 10,000 sq ft, low, middle and high, for at least 7 days, to find where it runs warm or cold and where the permanent monitoring sensors belong.
What is the temperature mapping procedure for a warehouse?
Agree the protocol, place a sensor every 5 to 10 m at three heights, run at least 7 days including a weekend, repeat in the other season where the seasons change the building, then review the signed report and put the permanent sensors at the warm and cold spots it finds.
How much does warehouse temperature mapping cost?
$4,750 to $7,900 per season for about 10,000 sq ft, in US dollars, before tax and shipping. A larger building takes more sensors, and is priced the same way.
How long does a warehouse mapping study take?
At least 7 days, including a weekend, in each season. The signed report comes 2 business days after the study ends.
Why map a warehouse in summer and in winter?
Because the building behaves differently. The roof and top racks run warm in summer, and the heating and dock doors change the pattern in winter. Across most of the US and Canada, both matter.
Does the warehouse have to be empty?
No. The protocol says which you want: a new warehouse can be mapped empty before it is first used, and a working one in normal use, with stock on the racks and the doors working. The weekend in the study shows the building at rest.
Can a warehouse be mapped remotely?
Yes, it is our default. We ship the sensors with a placement map, and your team places them while we check each spot on a video call. Assisted installation and full white-glove service are quoted separately.
How often should a warehouse be re-mapped?
After any significant change, such as new racking, a new HVAC unit or a new layout, and on a cycle such as every 3 years, following WHO guidance.
More temperature mapping
Book a study, or ask what yours would cost
Tell us the unit and the date.